In this post I will show how to use vRealize Hyperic Server + plugin to monitor NetApp Filers via vRealize Operations Manager (vROps).
You will find answers for the following topics/questions:
- Prerequisites to monitor NetApp via vRealize Hyperic Server.
- How to install and configure NetApp plugin for vRealize Hyperic Server?
- Overview of available metrics for monitoring NetApp.
- How to create a custom dashboard in vROps to monitor NetApp Filers?
Before configuring vRealize Hyperic Server (and also vROps) to monitor NetApp Filers you should follow the below posts:
- How to deploy and configure vRealize Operations Manager 6.x?
- How to integrate vROps with vRealize Hyperic Server?
If you still use vCenter Operations Manager (aka vCOps) 5.x, you should migrate it to vRealize Operations Manager 6.x following the post here.
Prerequisites
There are some prerequisites to monitor NetApp via vRealize Hyperic Server or/and vROps:
- The NetApp Filer must be enabled for SNMP.
- One Windows or Linux machine with Hyperic Agent installed.
Installation and configuration of NetApp plugin for vRealize Hyperic Server
Before monitoring NetApp Filers, we need to install and configure Hyperic plugin. The plugin connects to the NetApp Filer's SNMP Agent to discover NetApp resources. The NetApp Filer resource is discovered by the plugin's NetAppPlatformDetector class, which extends the NetworkDevicePlatformDetector support class.
Installing NetApp plugin
At first we need to install NetApp plugin in vRealize Hyperic Server. Please follow the below steps:
- Download the plugin from VMware Solution Exchange site.
- Log in to vRealize Hyperic Server as hqadmin.
- Click Administration (1) --> Plugin Manager (2).

- Click Add/Update Plugins (1). Then Select plugin (2) and click Upload (3).
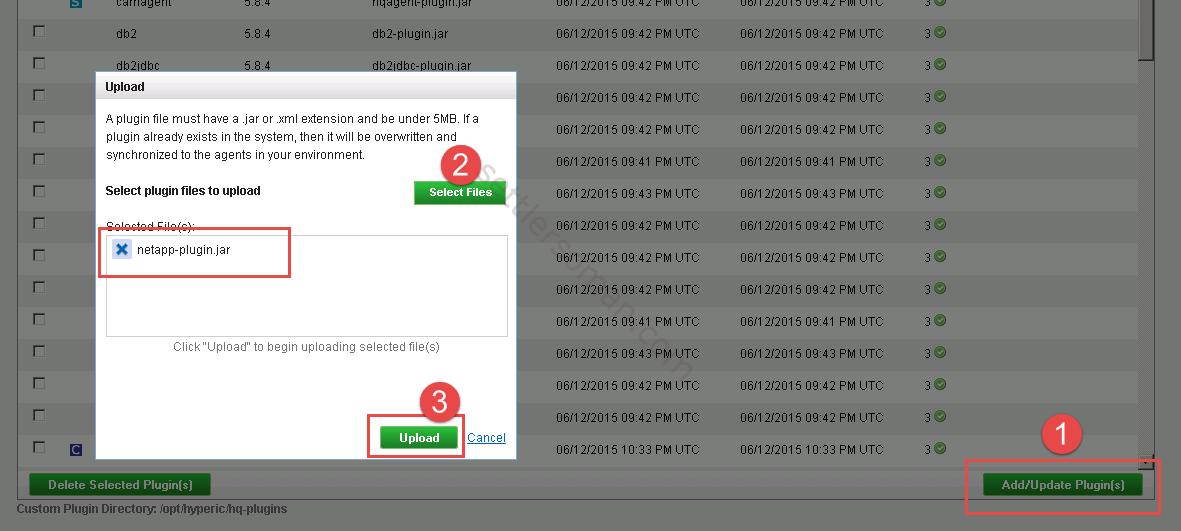
- You should see that NetApp plugin has been installed.

Configuring NetApp plugin
We have just installed the Hyperic plugin for NetApp. To configure NetApp plugin please follow the below steps:
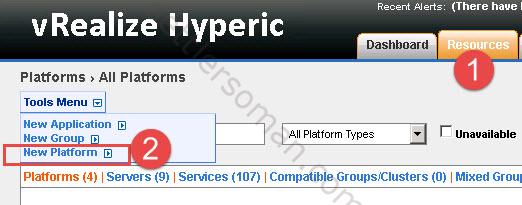
- Click Resources (1) and Select New Platform from the Tools menu. (2)
- Enter resource name (1), select "NetApp Filer" from the Platform Type pulldown. (2), IP Address (3) and Enter the FQDN of the Filer (4). Then click OK (5).
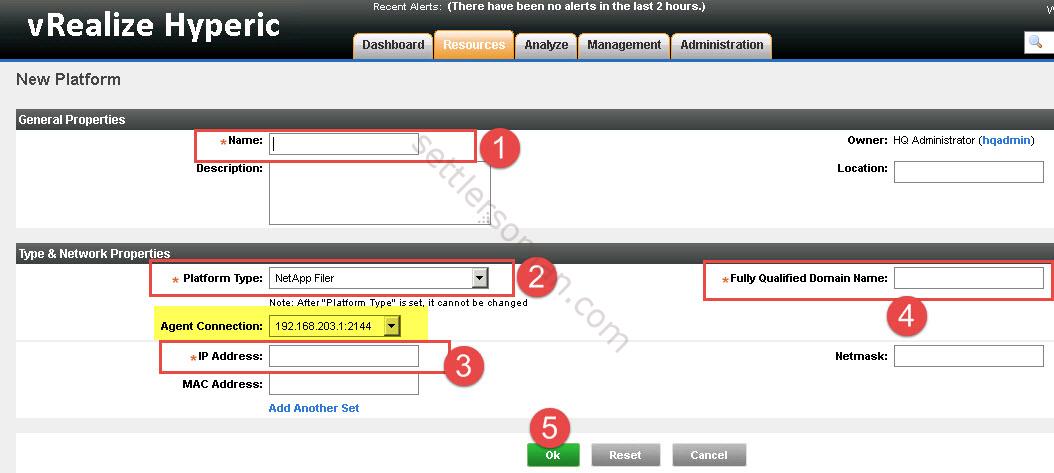 Note: Select the HQ Agent that will monitor the Filer from the Agent Connection pulldown list. The agent must be able to connect to the SNMP port on the Filer and you can use Linux or Windows Machine with Hyperic agent running as the Agent Connection.
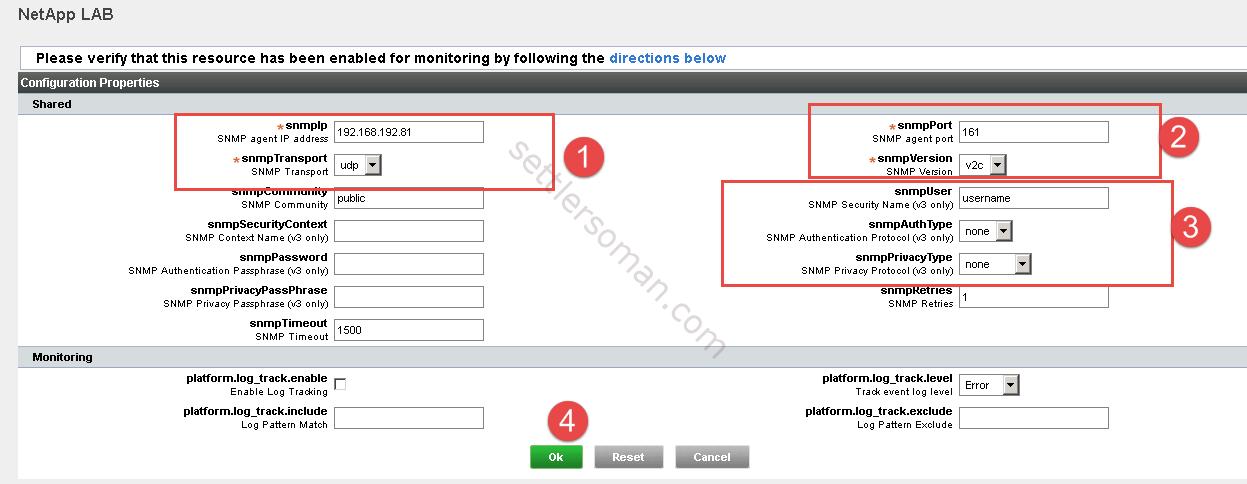
 - The Configuration Properties page for the NetApp Filer platform appears. Type NetApp IP Address and SNMP Transport option (1). Optionally, configure options (2) and (3) if you need to use SNMP v3. Click OK (4).
- Now, Hyperic Server should gather metrics from NetApp Filer.
For more information please follow guide available here.
Overview of available metrics for monitoring NetApp Filers
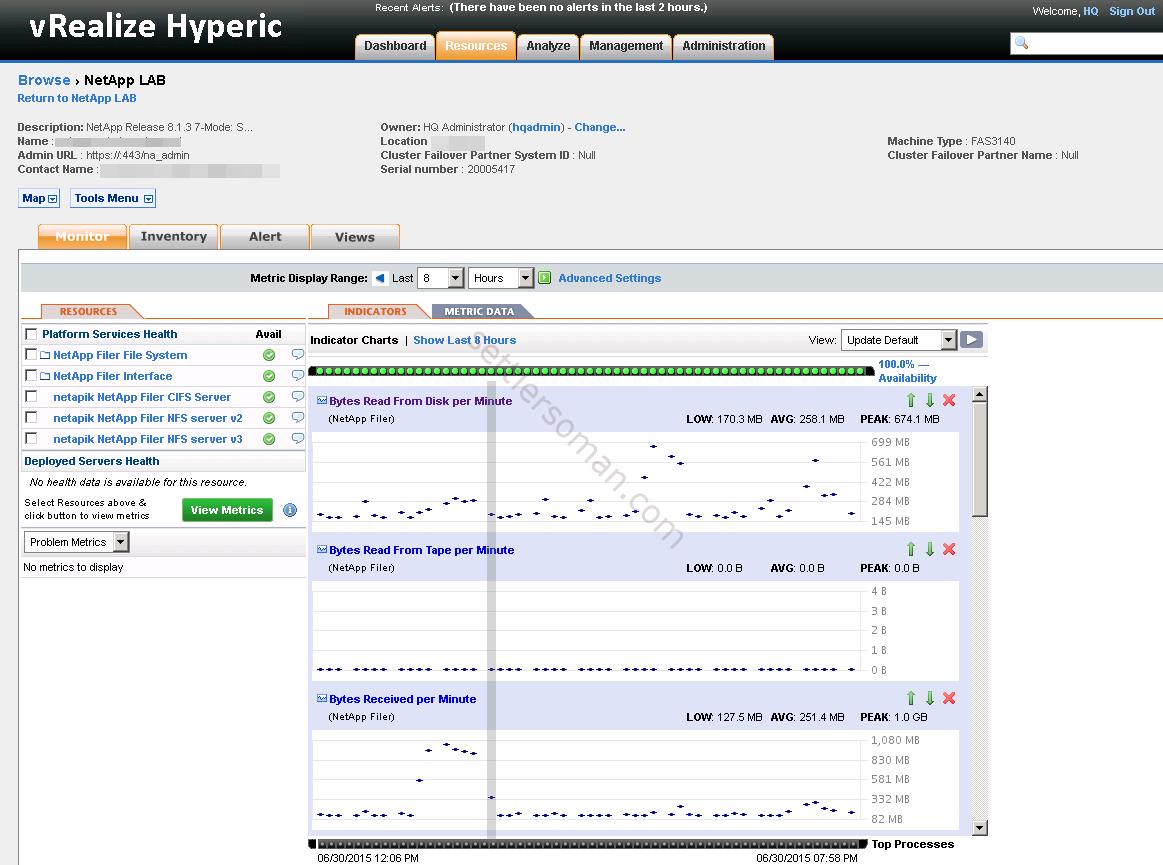
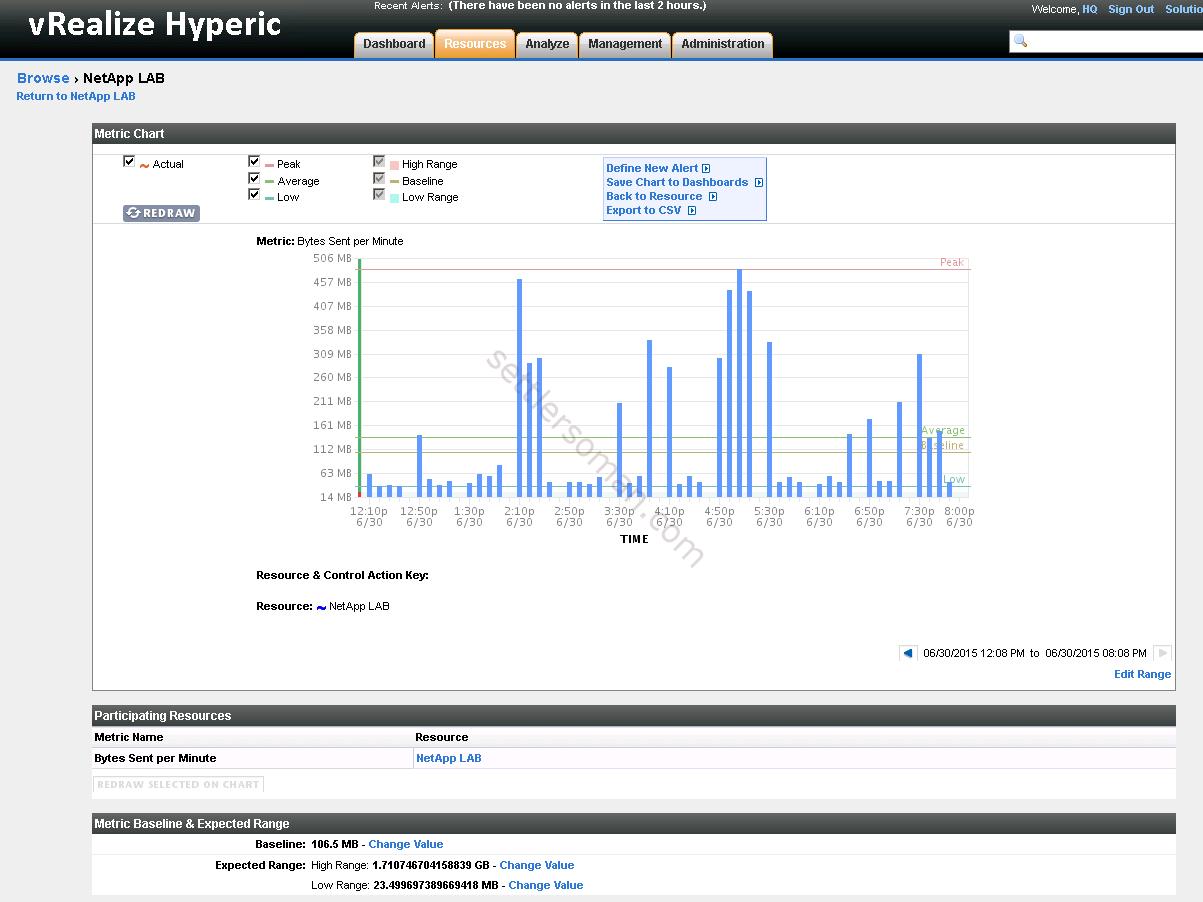
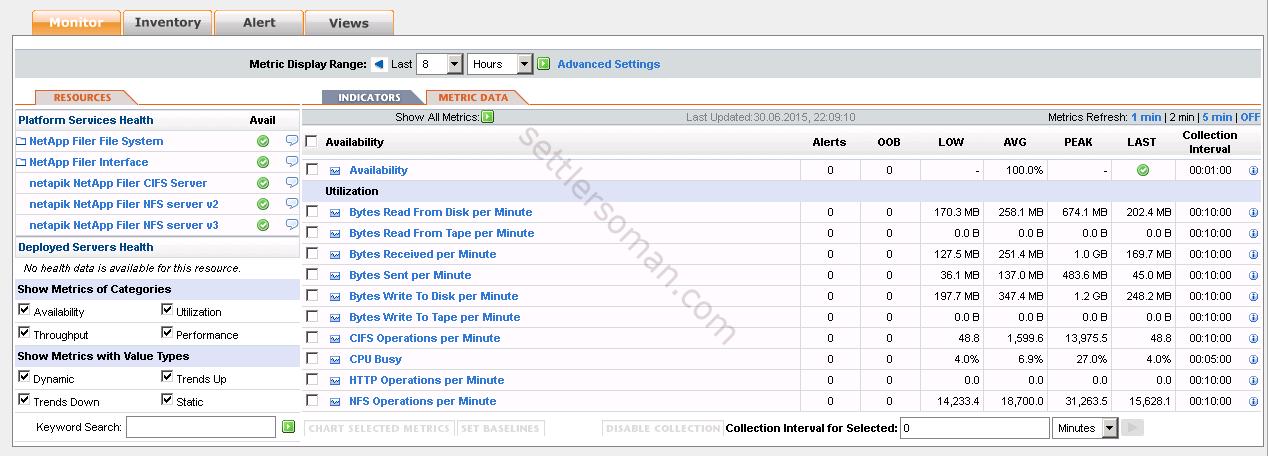
When you configure vRealize Hyperic Server plugin for NetApp Filers, there are available some metrics:
- CIFS/NFS Metrics such as Bytes Read/Write etc.
- Possibility to export to CSV.
- Specific information about gathered data.
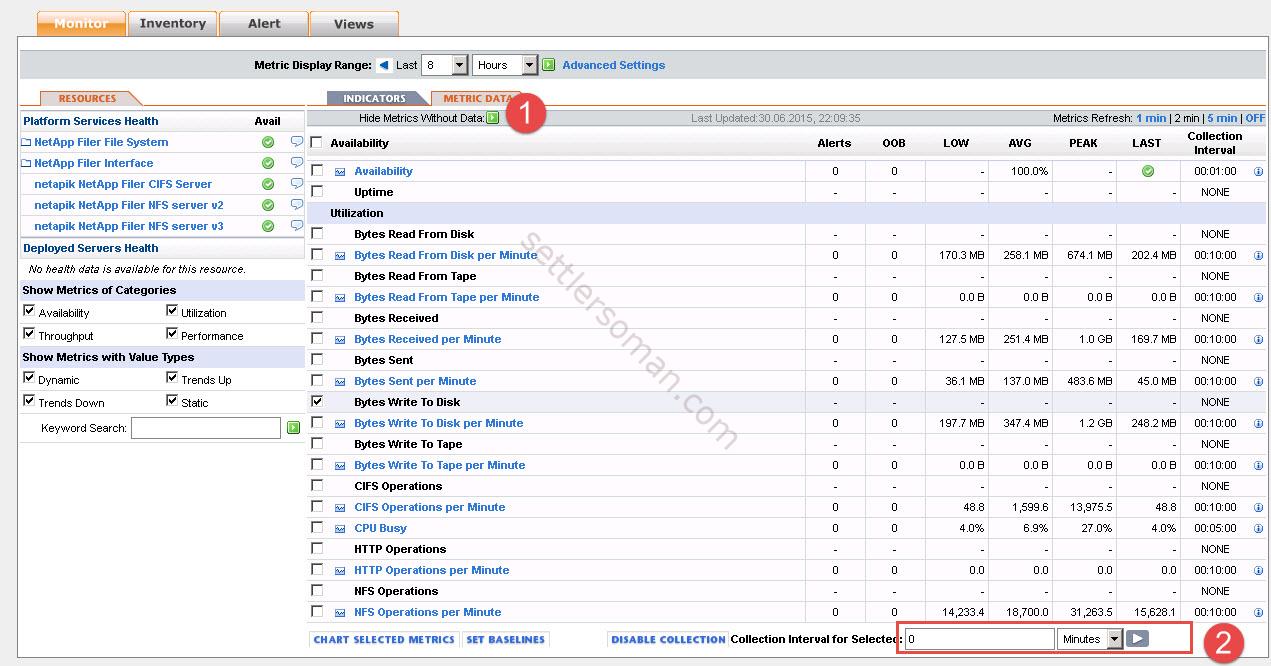
- Some metrics are not enabled (and shown (1)) by default. You can enable it.(2)
Creating a custom dashboard in vROps
We have installed and configured NetApp plugin in vRealize Hyperic Server. As you could see above, you can use Hyperic UI to monitor NetApp Filers. However, vROps (via Hyperic Server) can also be used to monitor storage arrays and I recommend to configure it.
Please remember that your vRealize Hyperic Server has to be integrated with vROps!
To create a custom dashboard to monitor NetApp metrics via vRealize Operations Manager please follow the below steps:
- Log in to vRealize Operations Manager (vROps).
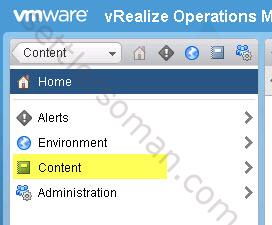
- In the left pane of vRealize Operations Manager, click the Content icon.
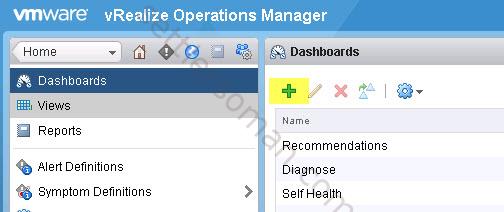
- Click Dashboards and the plus sign to create a dashboard and configure the dashboard.
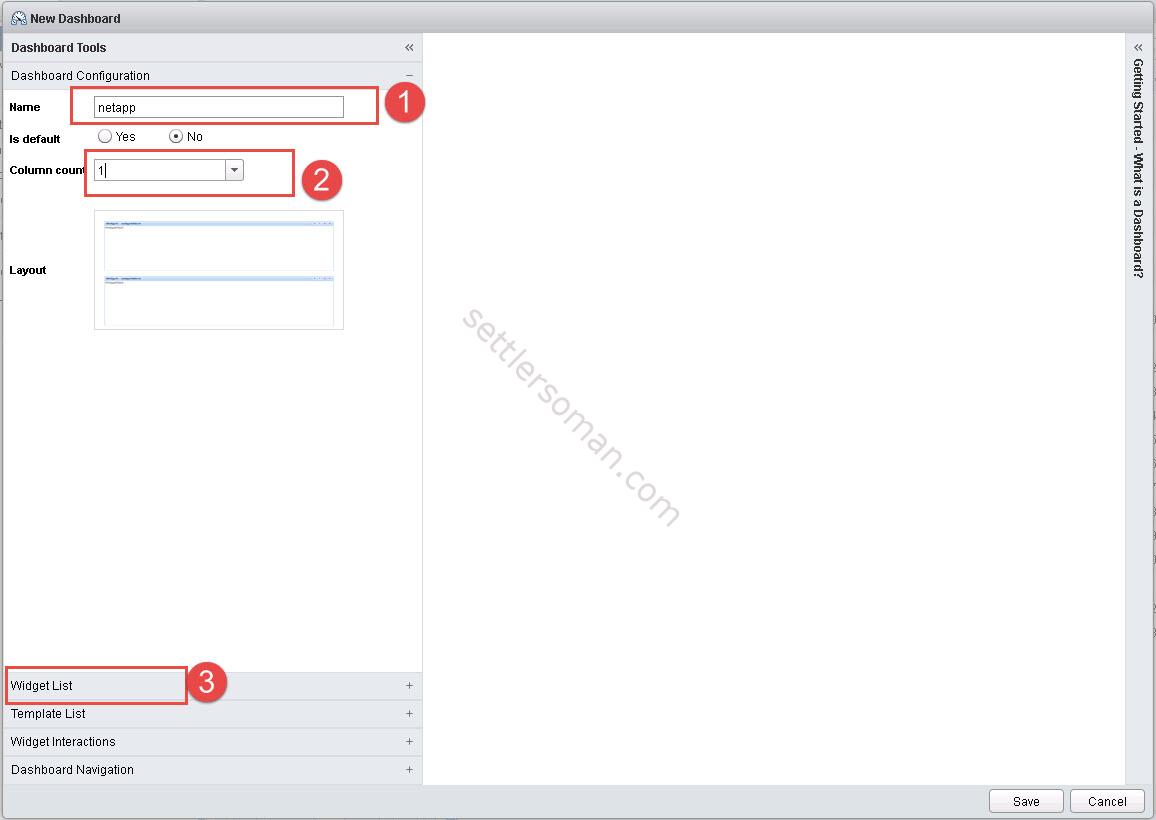
- Enter Dashboard name (1), Column counts (2) and then click Widget List (3).
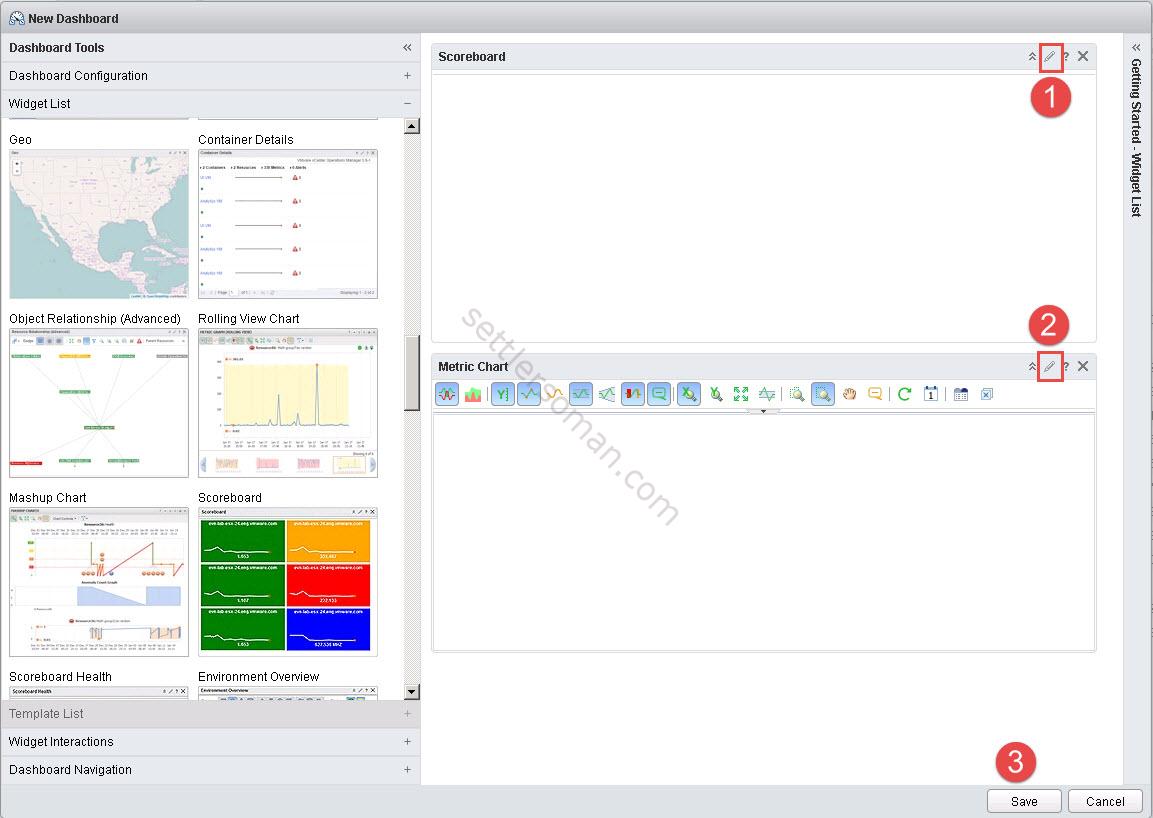
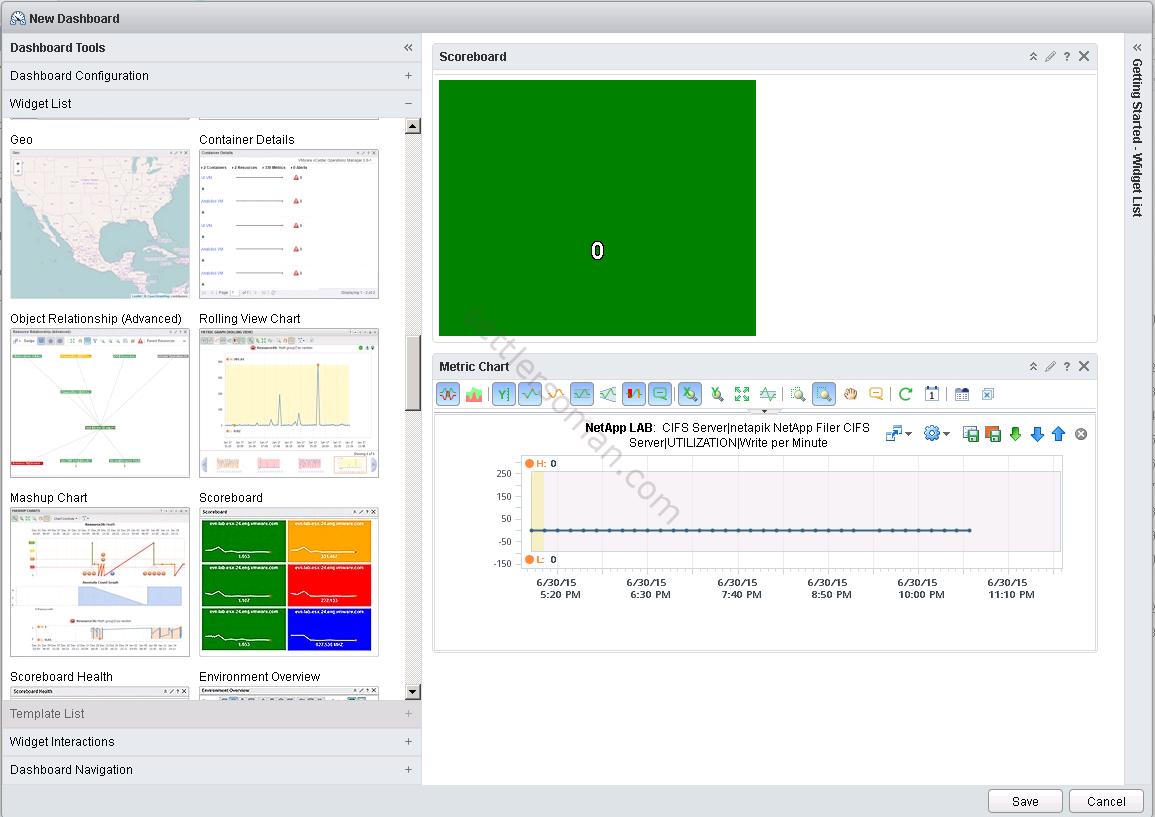
- Drag the widgets in the right panel to add them to the dashboard. On the below figure I used Scoreboard and Metric Chart widgets. Click pencil icon (1) (2) to edit widgets. Do not click Save yet (3).
 Enable Refresh Content and Self Provider. Then Select Objects Types --> NetApp Filer. Select NetApp Filer which you want to monitor and then select Metrics (I selected Read request 0-511 per Minute). Click Save.
 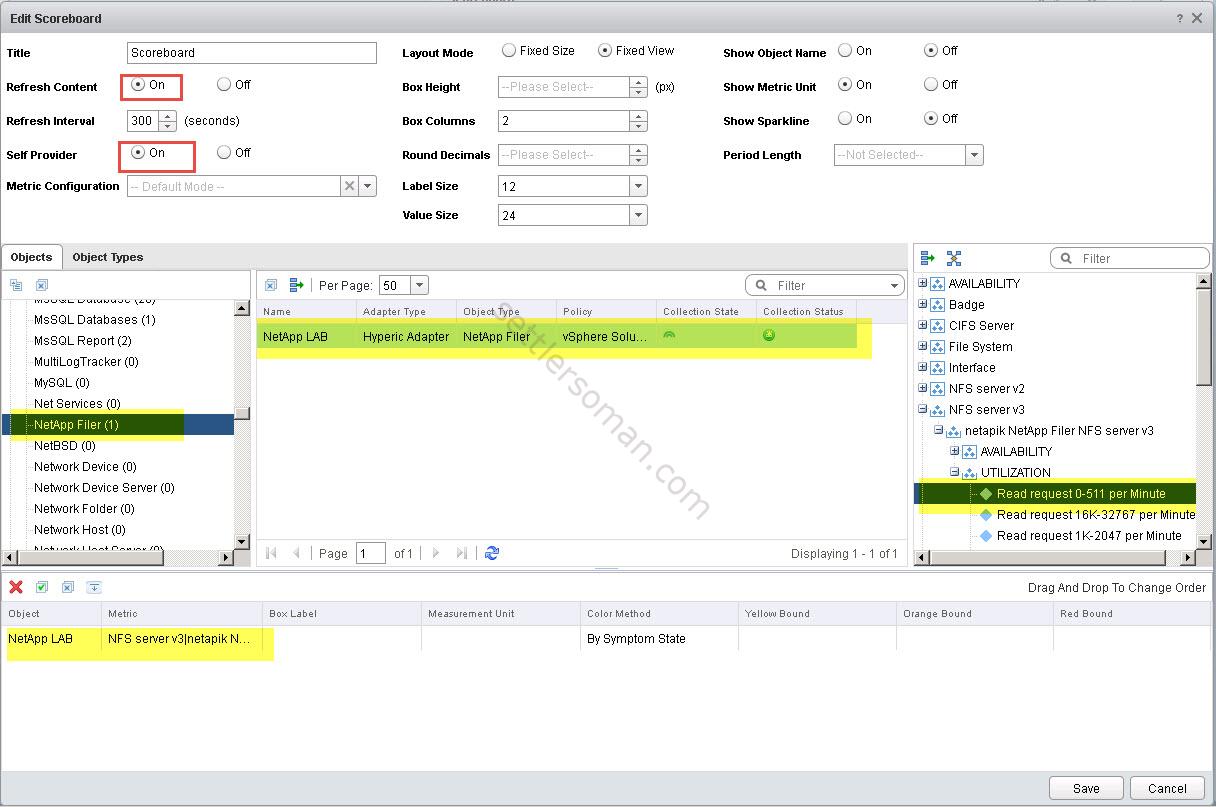 Repeat this steps for all widgets and then click Save (3).
 - You can add more widgets or metrics as well.
- On the below figure you can see my example: 2 widgets: Scoreboard (4 metrics) and Rolling View Chart (one metric).
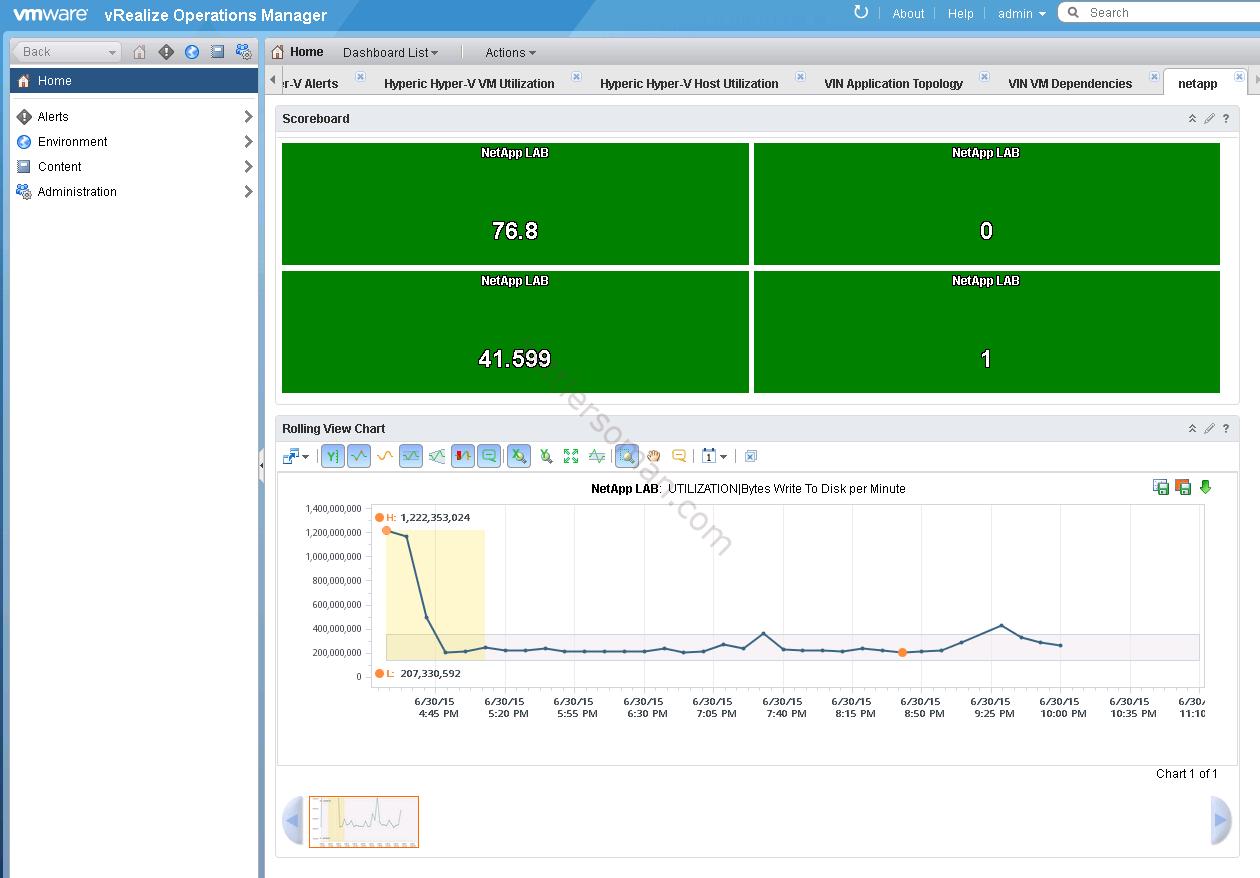
I have shown example how to configure a custom dashboard in vROps to monitor NetApp Filer. Please custom it as necessary 🙂
Conclusion
As you could see there are a lot of metrics that you could use to monitor NetApp Filers. You need to use vRealize Operations Manager Advanced or Enterprise. For more information please follow VMware vRealize Operations Manager guide to Third-Party solutions.
